Introduction
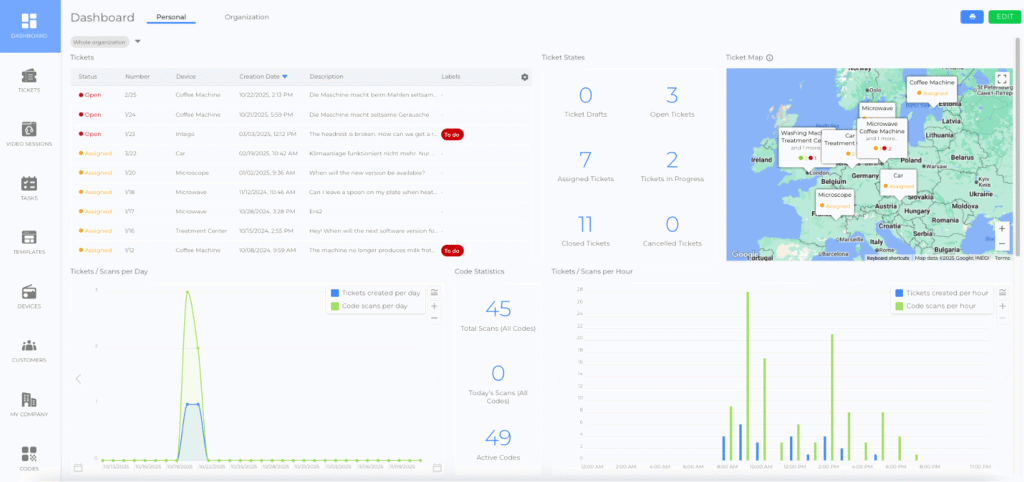
The Dashboard provides an at-a-glance overview of relevant data and statistics, helping you monitor organizational activities and access critical information for daily work. Fully customizable, the Dashboard allows users to place important data front and center, ensuring they see what matters most as soon as they log in. From tracking KPIs to organizing personal tasks, the Dashboard is a versatile tool that supports both organizational insights and individual productivity.

Dashboard Visibility Options
The Dashboard offers two visibility options to suit different user needs:
- Personal Dashboard:
- Customizable by each user to meet their specific requirements.
- Visible only to the user who configures it.
- Organizational Dashboard:
- Customizable only by administrators. Visible to all users within the organization, ensuring a consistent view and access to critical information. This ensures everyone has the same configuration and no one can claim they missed important data or updates.
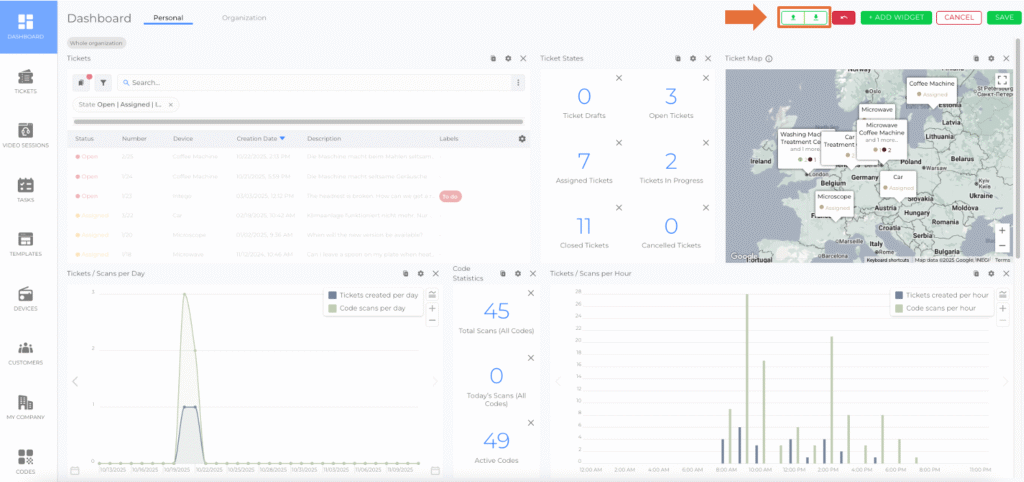
Dashboard configurations can be exported and imported. This allows layouts, filters, and widgets to be easily backed up or transferred to other environments and also restored. The feature is accessible via the editing the dashboard, supporting quick exchange or restoration of saved configurations.
To do this, click the Edit button in the upper right corner.
You will then be taken to the function for exporting or importing a dashboard – see the example image below.

For more details, see the article Import and Export of Dashboard Configurations.
Display Dashboard with Department-Driven Data
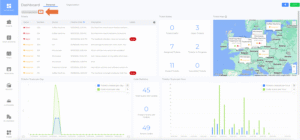
The dashboard can be configured to display information and statistics based on user selected department(s). In the upper left corner of the dashboard, there is a dropdown menu displaying the available departments (see example image 1) – by default, the entire organization is selected.
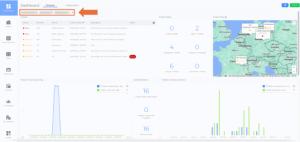
You can then select the different departments (see example image 2).
Your selection will be displayed under the term Dashboard (see example image 3).


Widget Types
The Dashboard is highly flexible and consists of widgets that display data in various formats. There are six widget types:
- Numbers Widget: Displays metrics such as percentages, sums, min/max, medians, and averages. (picture)
- List Widget: Customizable lists of tickets or video sessions based on filters. (picture)
- Map Widget: Displays the locations of tickets and departments on a map. (picture)
- Line Graph Widget: Tracks changes in selected data over time. (picture)
- Bar Graph Widget: Shows the distribution of selected data over a specific time frame. (picture)
- Ratings Widget: Lists rated tickets or video sessions. (picture)
How to Add Widgets
- Select Dashboard from the side menu.
- Click Edit.
- Click + Add Widget.
- Choose one of the following options:
- Select a predefined widget.
- Click Create Custom Widget.
- (Custom widgets only) From the list, select the information you want the widget to display.
- Note: Once the first item is selected, the list collapses to show only items compatible with the widget type.
- (Custom widgets only) Click Create.
- Click Save.
Additional Configuration Options
While in Edit mode, you can:
- Change the position of widgets using drag-and-drop. (video)
- Access widget-specific settings by clicking the gear icon in the widget header. (picture)
- Delete widgets. (picture)
- Restore the default configuration. (picture)
Widget-Specific Settings
- Change size. (picture)
- Edit titles. (video)
- Add filters. (picture)
- Edit data sources for graph widgets. (picture)
Printing the Dashboard
To print the Dashboard, click the Print icon. (picture)
Note: For optimal results, use the Chrome browser. Printing with Safari may not display as intended.
Dashboards for Other Entities
In addition to the main Dashboard, entities such as Templates, Devices, and Customers also have their own dashboards. These can be found under the Statistics tab within the details view of each entity.
Mobile Dashboard
The Mobile Dashboard is the central navigation point in the mobile application, designed to help users coordinate their tasks. With widgets such as Offers, Tickets, Video, Devices, and Scan, it ensures mobile users have quick access to essential information and functionality. For more details, refer to the article Mobile Dashboard (article).
